

|
FT - Study of Residue Periodicities in Sequences |
Pasquier, C.M., Promponas, V.I., Varvayannis, N.J. and Hamodrakas, S.J. |
 |
Index |  |
4. Description of the Output |  |
6. Bug reports and user feedback |
The use of the program is illustrated with the analysis of the sequence CCC4. This is a protein found in the eggshell of the fruit-fly Ceratitis Capitata. The characteristic feature of this protein is that it presents a strong repetition of the pattern 'SYSAPAP'. A 'FASTA' representation of this sequence is given below:
>CCC4

MNRFLCTFAAIVAVANGYAVGGGGGYGGRGGSGTVIGGQAYQILPALQVQTIAAAGGSSAGYGGSSAGYGASSGSYGASS
GGYGGSSNGYGASSAPSIDIGQLLAAVGGDLTAQEAAQLVNSLPSAGGPIIDTSGSSAGSSHQGSYPSGGNLAYVIQSGG
SSYSAPAPAASYSAPAPAPAASYSAPAPSYSAPAPAPAPSYSAPAPSYSAPAPSYSAPAPAPAPAAYSAPAPAVYSAPAP
AAYSAPAPAVYSAPAPAPAPAAYSAPAPAAYSAPAPAAYSAPASSGYGASAPAAAAPAAAHQPSAAAARSYISGSYGAAY
APAPAPAAGGAY
In the input form, we copy and paste the sequence in the appropriate text area and we choose 'FASTA' in the format frame.
By clicking on the Check button, we obtain the following information about the sequence:
In the statistics frame, we can see that Alanine is the more frequent residue (96) followed by Serine (54), Glycine (46) and Proline (45). If statistics are given as percentages, we have respecively 28.9% of Alanine, 16,2% of Serine, 13.8% of Glycine and 13.5% of Proline.
We choose to analyse the periodicity of the more frequent residue, then we enter a weight of 1 for Alanine in the frame Selection of residues , we set the cutoff to 0 to have a continuous graph and we choose a range of periodicities between 2 (min period) and 50 (max period).
By clicking on 'Submit', we obtain a result page composed of three parts: the summary of the query data, the result presented in a table and a graph (only if 'HTML page' is selected in the input form) displaying the relation between periods and intensities.
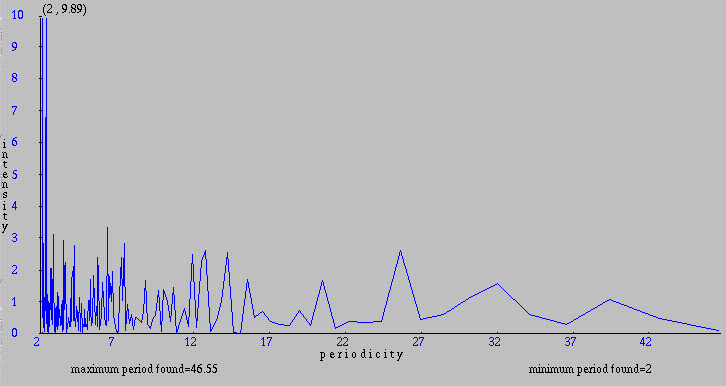
On the graphical representation below, we can see that the highests intensities are located between periods of 2 and 7 residues.

Note that we can obtain a graph with smoother lines by selecting a bigger 'embedding size'. Follow this link to see the same graph with an embedding size of 4096.
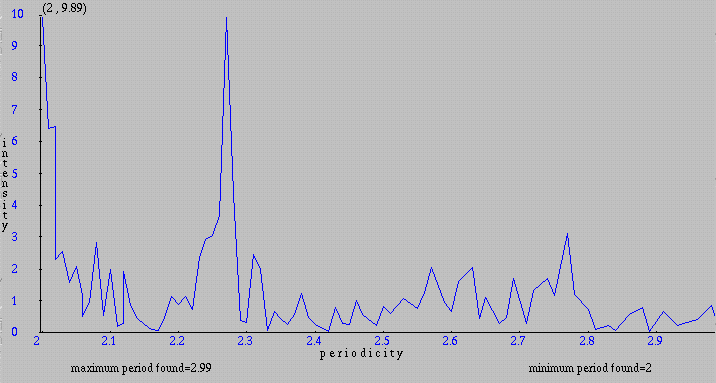
To have more details, we can return to the 'Input form' by clicking the Back button of the browser and set the maximum periodicity to 7. Now, we can see on the new graph that the highest intensities correspond to periodicities less than 3

We can again choose a smaller range of periodicities on the Input form. Below is the result for periodicities between 2 and 3:

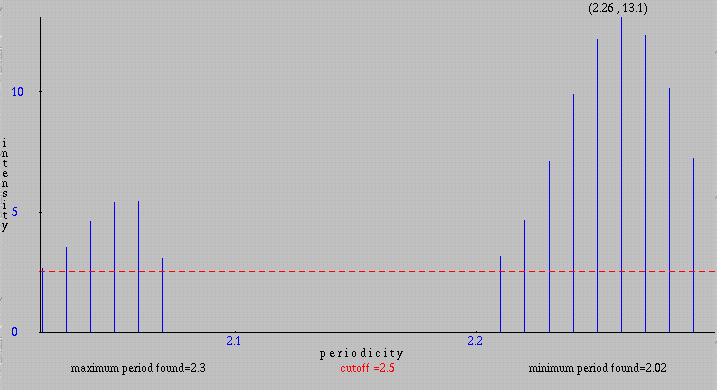
We can exclude periodicities with small intensities by specifying a cutoff (minimum intensity displayed) bigger than 0 and get a bar graph containing periodicities with intensity greater or equal to the cutoff. Below is the same graph displayed by using a cutoff of 2.5.

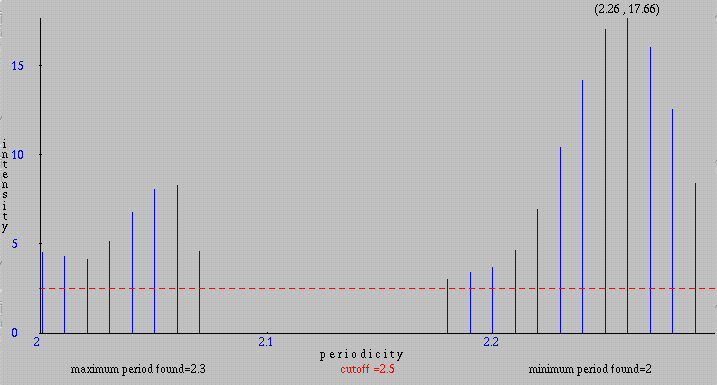
We can also examine only a part of the sequence by changing the default values of Start residue and End residue. Between residues 162 and 278, the pattern 'SYSAPAP' is repeated 13 times with 0 to 5 amino-acids between each repetition. This allows us to expect a periodicity for this pattern very close to 9. Effectively, the program produces for residues S, Y and P a periodicity of 8.98. The intensities between 7.12 and 7.82 obtained for this periodicity, for the selected residues, indicate a very small probability that this result is observed by chance (McLachlan, 1977). Below is the continuous graph obtained by searching for a periodicity between 3 and 50 for P in the range [162, 278].

Residues which appear between two consecutive occurrences of the pattern
'SYSAPAP' are solely 'A' and 'P'. Thus, in the selected part of the sequence
there is a repetition of a pattern written 'S Y S (A|P)+' in the BNF notation:
a group composed of 'S', 'Y' and 'S' followed by a repetition of 'A' or 'P'.
We can highlight the periodicity of 8.98 for these two groups by selecting
together 'S' and 'Y' then 'A' and 'P'. An intensity of 17.05 and 16.50 was
obtained for these two groups respectively. We can confirm with the program
that these two groups appear alternately by giving to each one a different
weight. By using, for example, 1 and -1 as weights for the two groups, an
intensity of 17.10 is obtained for the periodicity of 8.98.

Taken separately, 3 of the residues composing the pattern have high intensities for the periodicity of 8.98, respectively: 7.63 for S, 7.12 for Y, and 7.82 for P (there is not significant intensity for A for this periodicity). But, if we select all the residues composing the sequence by specifying a weight of 1 for each, we cannot isolate the periodicity with the Fourier transform. The solution is to specify a different weight for each residue in order to define a pattern. By specifying, for example, a weight of 1 for A, 2 for P, 3 for S and 4 for Y a very high intensity of 9.77 for the periodicity 8.89 is obtained.