 |
Additional and not yet published material concerning the PRED-TMR algorithm |
Annexe I :Propensity values for the 20 amino acid residue types to belong to transmembrane segments and a hydrophobicity scale , calculated from the entire SwissProt database, release 35.
| Residue | Pi | Hi |
| Phenylalanine (F) | 2.235 | 0.804 |
| Isoleucine (I) | 2.083 | 0.734 |
| Leucine (L) | 1.845 | 0.612 |
| Tryptophan (W) | 1.790 | 0.582 |
| Valine (V) | 1.756 | 0.563 |
| Methionine (M) | 1.502 | 0.407 |
| Alanine (A) | 1.383 | 0.324 |
| Cysteine (C) | 1.202 | 0.184 |
| Glycine (G) | 1.158 | 0.147 |
| Tyrosine (Y) | 1.075 | 0.073 |
| Threonine (T) | 0.879 | -0.129 |
| Serine (S) | 0.806 | -0.216 |
| Proline (P) | 0.597 | -0.516 |
| Histidine (H) | 0.395 | -0.930 |
| Asparagine (N) | 0.389 | -0.944 |
| Glutamine (Q) | 0.273 | -1.300 |
| Aspartic acid (D) | 0.153 | -1.877 |
| Glutamic acid (E) | 0.131 | -2.033 |
| Arginine (R) | 0.124 | -2.085 |
| Lysine (K) | 0.108 | -2.230 |
Hi = measurement of the "hydrophobicity" of a residue of type i
Annexe II :Positional propensities for the 20 amino acid residue types in the relevant nominal positions of decapeptides (0-9; see also Figure 1 and Methods) at the N and C-terminal ends of transmembrane segments, derived from a statistical analysis of the entire SwissProt database, release 35.
0 1 2 3 4 5 6 7 8 9 | |
|
|
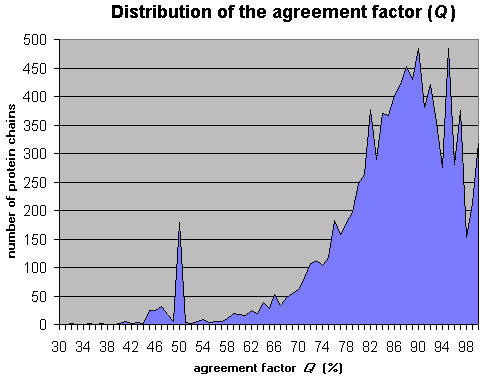
Annexe III :Distribution of the agreement factor Q , produced after applying the PRED-TMR algorithm on all transmembrane proteins of the SwissProt database, release 35 (9392 sequences).
