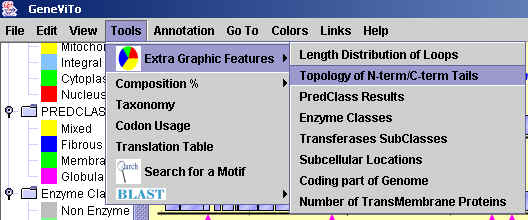
By clicking Tools, Extra Graphic Features you can view:
a.) A graphical distribution of the length of loopsnon-transmembrane segments, in a Bar chart
You can do this by selecting Tools, Extra Graphic Features, Length of loops
b.) A graphical repsresentation of the average number of transmembrane proteins with a specific
orientationextracytoplasmic, cytoplasmic of their tailsN,C terminals in a Pie chart
You can do this by selecting Tools, Extra Graphic Features, Topology of Nterm/C-term
c.) A graphical repsresentation of the number of proteins that belong in one of the four
structural classesPRED-CLASS in a Pie chart. You can do this by selecting
Tools, Extra Graphic Features, PredClass Results
d.) A graphical repsresentation of the average number of proteins with annotated
Enzyme Classification that belong in one of 6 E.C. classes, in a Pie chart
You can do this by selecting Tools, Extra Graphic Features, Enzyme Classes
e.) A graphical repsresentation of the average number of annotated enzymes that
belong in the Transferases subclass2.-.-.-, in a Pie chart
You can do this by selecting Tools, Extra Graphic Features, Transferases SubClasses
f.) A graphical repsresentation of the average number of proteins according to their annotated
Subcellular location, in a Pie chart. You can do this by selecting Tools,
Extra Graphic Features, Subcellular Locations
g.) A graphical repsresentation of the number of predicted transmembrane proteins with 1,2,..
transmembrane segments, in a Bar chart. You can do this by selecting Tools,
Extra Graphic Features, Number of Transmembrane Proteins